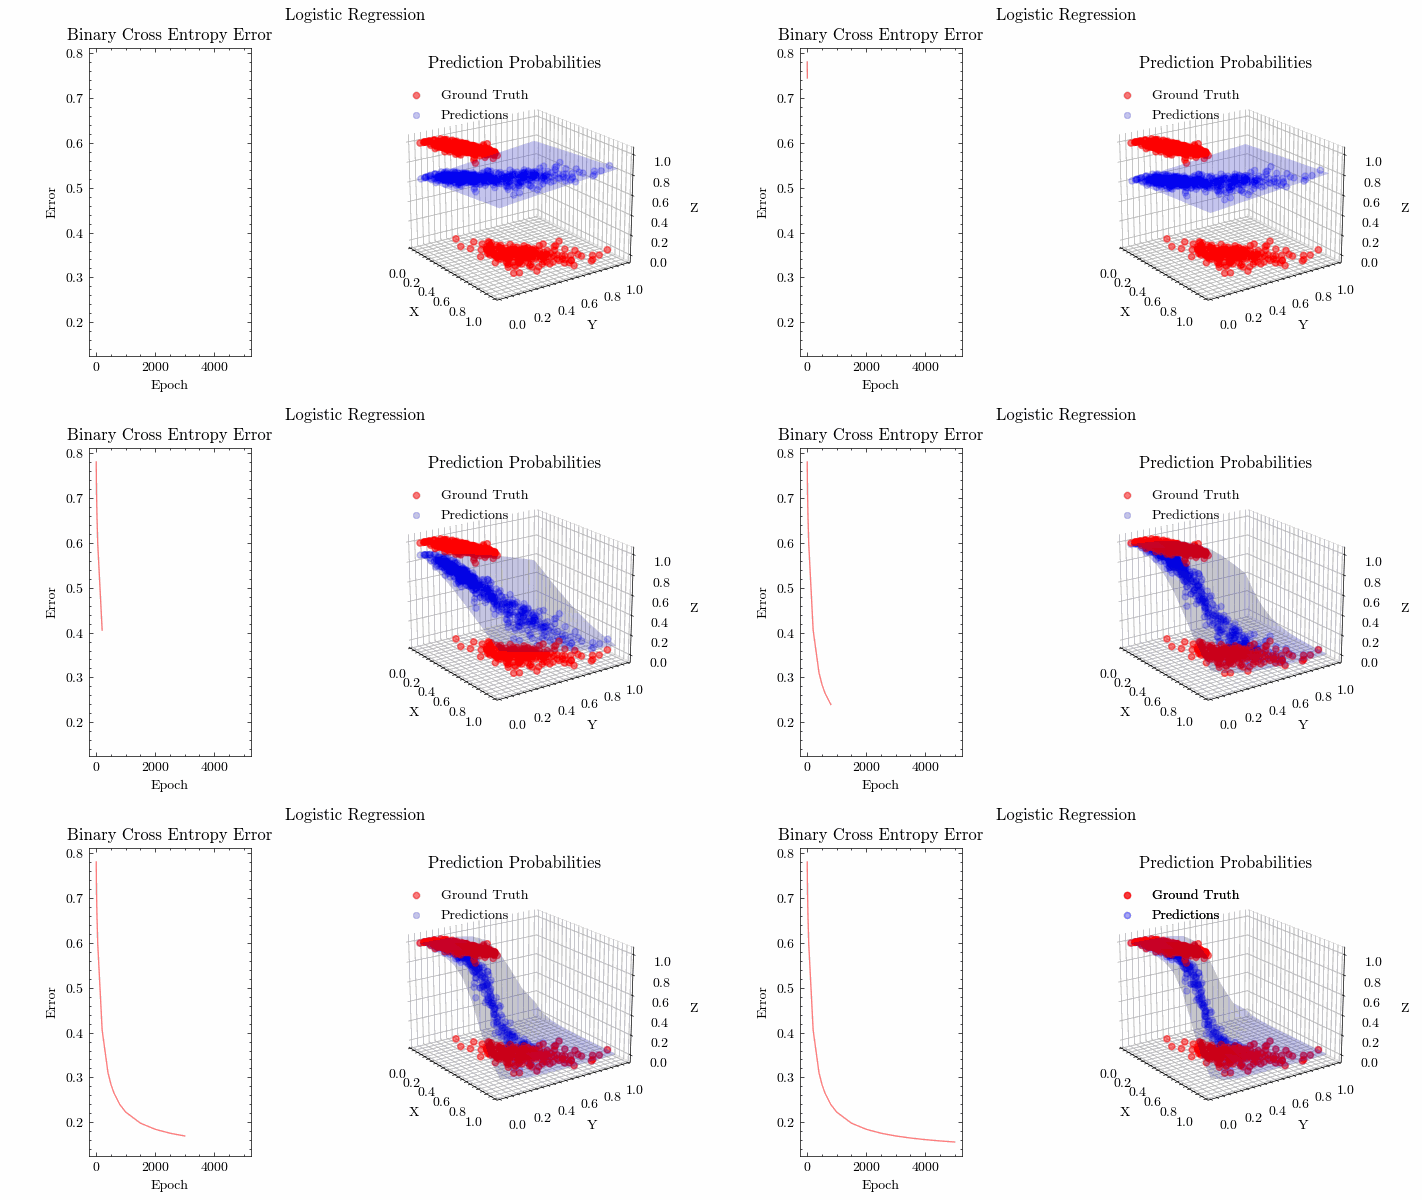
Logistic Regression#
Logistic regression is a binary classification model that finds the optimal weights and bias and returns the probabilities of the two classes.
# import numpy as np
import autograd.numpy as np
from autograd import grad
from autograd import elementwise_grad as egrad

%matplotlib widget
import matplotlib.pyplot as plt
from mpl_toolkits.mplot3d import Axes3D

import sklearn.datasets as skdatasets

from celluloid import Camera
import scienceplots
from IPython.display import Image

np.random.seed(0)
plt.style.use(["science", "no-latex"])
Training Dataset#
Let’s import the breast cancer dataset. The logistic regression will perform binary classification using two features of the tumor: worst concave points and worst perimeter (the largest values measured across the tumor’s cells). Both features are min-max normalized to the range [0, 1].
dataset = skdatasets.load_breast_cancer()

features_used = [-3, -8]
X = dataset.data[:, features_used]
feature_names = dataset.feature_names[features_used]

# min-max normalize the features along the columns
X_min_vals = X.min(axis=0)
X_max_vals = X.max(axis=0)
X = (X - X_min_vals) / (X_max_vals - X_min_vals)

Y = dataset.target
target_names = dataset.target_names

fig = plt.figure()
ax = fig.add_subplot()

ax.scatter(X[:, 0], X[:, 1], c=Y, alpha=0.5)
ax.set_xlabel(feature_names[0])
ax.set_ylabel(feature_names[1])
ax.set_title("Breast Cancer Dataset")
Text(0.5, 1.0, 'Breast Cancer Dataset')
Activation Function#
Recall that the output of the perceptron was the dot product between the weight vector \(\vec{w}\) and the input vector \(\vec{x}\) plus a constant bias term \(b\):
Perceptron: \(y=w^Tx + b\)
Activation functions are applied after the computation.
Sigmoid Function#
In order to do binary classification, we would like to limit the value of the output to be in the range (0, 1) and get a value to represent the probability of the output being assigned to either class. The sigmoid function is perfect for this:
sigmoid = lambda x: 1 / (1 + np.exp(-x))
def plot(fx, x_min, x_max, points=100, title=""):

    x = np.linspace(x_min, x_max, points)
    y = fx(x)

    fig, axes = plt.subplots()
    axes.plot(x, y)
    axes.set_xlabel("X")
    axes.set_ylabel("Y")
    axes.set_title("Activation Function")


x_min = -10
x_max = 10
points = 100
plot(sigmoid, x_min, x_max, points)
Gradient of Sigmoid Function#
Gradient Descent will be used later to find the optimal weight values. As a result, let’s calculate the gradient of the sigmoid function:
sigmoid_prime = lambda x: np.exp(-x) / np.power((1 + np.exp(-x)), 2)
plot(sigmoid_prime, x_min, x_max, points)
Autograd#
Alternatively, you can use autograd to differentiate a numpy function. Pytorch and JAX also implement autograd.
# grad() differentiates scalar inputs
sigmoid_prime_grad = grad(sigmoid)
# egrad() differentiates vectorized inputs
sigmoid_prime_egrad = egrad(sigmoid)

x = np.linspace(x_min, x_max, points)
assert sigmoid_prime_grad(x[0]) == sigmoid_prime(x[0])
assert np.allclose(sigmoid_prime_egrad(x), sigmoid_prime(x))

plot(sigmoid_prime_egrad, x_min, x_max, points)
Loss Function#
The binary cross entropy loss function will be used for logistic regression. This loss function is derived from the definition of maximum likelihood estimation.
For the binary classification model, the probability of the first class (\(Y=1\)) is the sigmoid function applied to the dot product of the weight vector \(\vec{w}\) and the input vector \(\vec{x}\) plus the bias \(b\). The probability of the other class (\(Y=0\)) is 1 minus the probability of the first class.
Maximum Likelihood Estimation#
Maximum likelihood estimation finds the optimal weights and bias to maximize the probability of seeing the training data.
The probability of observing the label \(y \in \{0, 1\}\) in terms of \(\vec{w}\) and \(b\) is the following. This is a Bernoulli distribution.
With a training dataset of \(n\) examples with features \(\vec{x}_i\) and labels \(y_i\), the total probability is the product of the probabilities of all the training examples. This is the likelihood \(\mathcal{L}(\vec{w}, b)\) of the training dataset with the current weights and bias.
Keep in mind that we want to find the set of optimal parameters \(\vec{w}\) and \(b\) that maximize the total likelihood.
In order to find the optimal weights and bias for the logistic regression model, we use gradient descent, which is a solution to optimization problems. We have to take the partial derivative of the likelihood with respect to \(\vec{w}\) and \(b\).
In its current form, the total probability is a lot of multiplications. Per the product rule for derivatives, the partial derivatives will also be a lot of multiplication. In order to avoid this, we can take the logarithm of the likelihood, which converts the multiplications into additions. Since the logarithm is an increasing function, the weights and bias that maximize the log-likelihood also maximize the likelihood.
We define the negative (multiply the equation above by -1) log of the likelihood as the binary cross entropy loss function, so maximizing the likelihood becomes minimizing the loss. Let’s also divide by the number of training examples to make this the average loss across the \(n\) examples.
Binary Cross Entropy Loss Function#
Recall that \(\hat y = \sigma{(\vec{w} \cdot \vec{x} + b)} = \frac{1}{1+e^{-(\vec{w} \cdot \vec{x} + b)}}\)
To simplify the calculation of the loss, let’s rewrite it in terms of \(\hat y_i\):
def bce(y_true, y_pred):
    return -np.sum(y_true * np.log(y_pred) + (1 - y_true) * np.log(1 - y_pred))
Loss Function in Terms of W and B#
Before taking the partial derivative of the loss function with respect to \(\vec{w}\) and \(b\), let’s simplify it to make the calculation easier.
\(\hat y = \sigma{(\vec{w} \cdot \vec{x} + b)} = \frac{1}{1+e^{-(\vec{w} \cdot \vec{x} + b)}}\)
Loss Function Gradient#
Gradient of the loss function with respect to \(\vec{w}\):
def bce_dw(x, y_true, y_pred):
    # gradient for a single training example: one entry per weight
    return x * (y_pred - y_true)
Gradient of the loss function with respect to \(b\):
def bce_db(y_true, y_pred):
    return y_pred - y_true
Gradient Descent#
With the gradients of the binary cross entropy loss with respect to \(\vec{w}\) and \(b\), the gradient descent equations are below.
In the code, the weights and bias are updated after each training example, rather than once per pass over the dataset. This is stochastic gradient descent with a batch size of 1. For a single example \(i\), the sum over the \(n\) examples becomes a single term, so each update is \(\vec{w} = \vec{w} - \eta \, \vec{x}_i (\hat y_i - y_i)\) and \(b = b - \eta (\hat y_i - y_i)\).
Gradient Descent for weights \(\vec{w}\):
Gradient Descent for bias \(b\):
def gradient_descent(weights, x, bias, y_true, y_pred, learning_rate):
    weights = weights - learning_rate * bce_dw(x, y_true, y_pred)
    bias = bias - learning_rate * bce_db(y_true, y_pred)

    return weights, bias
Graphing functions#
Utility functions to create the visualizations.
def create_plots():
    fig, ax = plt.subplots(1, 3, figsize=(16 / 9.0 * 4, 4 * 1))
    fig.suptitle("Logistic Regression")

    ax[0].set_xlabel("Epoch", fontweight="normal")
    ax[0].set_ylabel("Error", fontweight="normal")
    ax[0].set_title("Binary Cross Entropy Error")

    ax[1].axis("off")
    ax[2].axis("off")

    ax[2] = fig.add_subplot(1, 2, 2, projection="3d")
    ax[2].set_xlabel("X")
    ax[2].set_ylabel("Y")
    ax[2].set_zlabel("Z")
    ax[2].set_title("Prediction Probabilities")
    ax[2].view_init(20, -35)

    camera = Camera(fig)
    return ax[0], ax[2], camera


def plot_graphs(
    ax0,
    ax1,
    idx,
    visible_mse,
    mse_idx,
    errors,
    features,
    labels,
    predictions,
    points_x,
    points_y,
    surface_predictions,
):
    ax0.plot(
        mse_idx[visible_mse][: idx + 1],
        errors[visible_mse][: idx + 1],
        color="red",
        alpha=0.5,
    )

    # Plot Logistic Regression Predictions
    # Ground truth and training data
    ground_truth_legend = ax1.scatter(
        features[:, 0],
        features[:, 1],
        labels,
        color="red",
        alpha=0.5,
        label="Ground Truth",
    )
    # Logistic Regression Predictions
    predictions_legend = ax1.scatter(
        features[:, 0],
        features[:, 1],
        predictions,
        color="blue",
        alpha=0.2,
        label="Prediction",
    )
    ax1.plot_surface(
        points_x,
        points_y,
        surface_predictions.reshape(dims, dims),
        color="blue",
        alpha=0.2,
    )
    ax1.legend(
        (ground_truth_legend, predictions_legend),
        ("Ground Truth", "Predictions"),
        loc="upper left",
    )
Training the model#
def fit(
    w0, b0, features, labels, dims, epochs, learning_rate, optimizer, output_filename
):
    mse_idx = np.arange(1, epochs + 1)
    errors = np.full(epochs, -1.0)
    ax0, ax1, camera = create_plots()

    points = np.linspace(0, 1, dims)
    points_x, points_y = np.meshgrid(points, points)
    surface_points = np.column_stack((points_x.flatten(), points_y.flatten()))

    weights = w0
    bias = b0

    for idx in range(epochs):
        error = 0
        predictions = np.array([])
        surface_predictions = np.array([])

        # fit the model on the training data
        for x, y in zip(features, labels):
            output = sigmoid(np.dot(weights, x) + bias)

            predictions = np.append(predictions, output)

            # Store Error
            error += bce(y, output)

            # Gradient Descent
            weights, bias = optimizer(weights, x, bias, y, output, learning_rate)

        # average loss over the training examples
        error /= len(features)

        # Visualization
        if (
            idx < 5
            or (idx < 15 and idx % 5 == 0)
            or (idx <= 50 and idx % 25 == 0)
            or (idx <= 1000 and idx % 200 == 0)
            or idx % 500 == 0
        ):
            for surface_point in surface_points:
                output = sigmoid(np.dot(weights, surface_point) + bias)
                surface_predictions = np.append(surface_predictions, output)

            print(f"epoch: {idx:>4}, BCE: {round(error, 4)}")

            # Plot BCE
            errors[idx] = error
            visible_mse = errors != -1

            plot_graphs(
                ax0,
                ax1,
                idx,
                visible_mse,
                mse_idx,
                errors,
                features,
                labels,
                predictions,
                points_x,
                points_y,
                surface_predictions,
            )

            camera.snap()

    animation = camera.animate()
    animation.save(output_filename, writer="pillow")
epochs = 5001
learning_rate = 0.0005
dims = 10

w0 = np.random.rand(X[0].shape[0])
b0 = np.random.rand()

output_filename = "logistic_regression.gif"
fit(w0, b0, X, Y, dims, epochs, learning_rate, gradient_descent, output_filename)
epoch:    0, BCE: 0.7806
epoch:    1, BCE: 0.7704
epoch:    2, BCE: 0.7611
epoch:    3, BCE: 0.7527
epoch:    4, BCE: 0.7449
epoch:    5, BCE: 0.7379
epoch: 10, BCE: 0.7097
epoch: 25, BCE: 0.6582
epoch: 50, BCE: 0.5985
epoch: 200, BCE: 0.4056
epoch: 400, BCE: 0.3097
epoch: 500, BCE: 0.2841
epoch: 600, BCE: 0.2653
epoch: 800, BCE: 0.2395
epoch: 1000, BCE: 0.2226
epoch: 1500, BCE: 0.1979
epoch: 2000, BCE: 0.1843
epoch: 2500, BCE: 0.1756
epoch: 3000, BCE: 0.1694
epoch: 3500, BCE: 0.1648
epoch: 4000, BCE: 0.1612
epoch: 4500, BCE: 0.1583
epoch: 5000, BCE: 0.1559
Image(filename=output_filename)