K-Means Clustering#
K-Means is an unsupervised clustering algorithm that assigns each point to its closest centroid. It is a quick way of grouping data points together and identifying outliers. The downside of this algorithm is that you have to choose the number of clusters \(K\) ahead of time, and the result depends on where the centroids start. However, it is very easy to implement and has many use cases.
Import the libraries.
import numpy as np

import matplotlib.pyplot as plt
import scienceplots

from IPython.display import Image
from celluloid import Camera

np.random.seed(0)
plt.style.use(["science", "no-latex"])
Example Dataset#
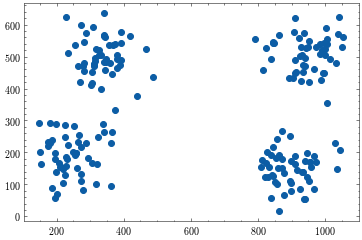
Let’s generate a dataset with 4 clusters of points. Each cluster is sampled from a normal distribution around its own center. Since we know the data has 4 clusters, we can check whether the Elbow Method below recovers \(K = 4\).
K = 12
w = 1200
h = 675

# the centers of the 4 clusters in the dataset
cluster_centers = np.array([[250, 175], [900, 150], [350, 500], [950, 520]])
cluster_std = 60
pts_per_cluster = 50
nums = len(cluster_centers) * pts_per_cluster

colors = np.random.rand(K, 3)

pts = np.concatenate(
    [
        np.random.normal(center, cluster_std, size=(pts_per_cluster, 2))
        for center in cluster_centers
    ]
)
pts = np.clip(pts, [0, 0], [w, h])
x = pts[:, 0]
y = pts[:, 1]

# plot the points
fig = plt.figure()
ax = fig.add_subplot(111)

ax.scatter(x, y)
<matplotlib.collections.PathCollection at 0x111b18ac0>
Distance Functions#
When assigning points to centroids, we assign them to the closest centroid. In order to quantify this, we need to state how we measure distance. The following are 2 examples of distance functions.
Given point \(p_1\) at \((x_1, y_1)\) and point \(p_2\) at \((x_2, y_2)\), we can define the following distance functions:
Euclidean Distance: \(\sqrt{(x_2-x_1)^2 + (y_2-y_1)^2}\)
Manhattan Distance: \(|x_2-x_1| + |y_2-y_1|\)
def euclidean_distance(p1, p2):
    return np.sqrt((p1[0] - p2[0]) ** 2 + (p1[1] - p2[1]) ** 2)


def manhattan_distance(p1, p2):
    return abs(p1[0] - p2[0]) + abs(p1[1] - p2[1])
K Means Setup#
At the beginning, the centroids are initialized with random x and y values.
centroids_x = np.random.randint(0, w, size=K)
centroids_y = np.random.randint(0, h, size=K)
centroids = np.column_stack((centroids_x, centroids_y)).astype(float)
Graphing Functions#
Create a helper function to create a plot with the mean squared distance on the left and the centroids on the right. Also initialize variables for the visualization, like the mean squared distance for each value of K.
def create_plots():
    fig, ax = plt.subplots(1, 3, figsize=(16 / 9.0 * 4, 4 * 1), layout="constrained")
    fig.suptitle("K-Means Clustering Unsupervised")

    ax[0].set_xlabel("K Clusters", fontweight="normal")
    ax[0].set_ylabel("Mean Squared Distance", fontweight="normal")
    ax[0].set_title("Elbow Method")

    ax[1].axis("off")
    ax[2].axis("off")

    ax[2] = fig.add_subplot(1, 2, 2)
    ax[2].set_xlabel("X")
    ax[2].set_ylabel("Y")
    ax[2].set_title("Centroids")

    camera = Camera(fig)
    return ax[0], ax[2], camera

boundary_div = 25
x_boundary_inc = int(w / boundary_div)
y_boundary_inc = int(h / boundary_div)

x_boundary = np.linspace(0, w, x_boundary_inc + 1)
y_boundary = np.linspace(0, h, y_boundary_inc + 1)
x_boundary, y_boundary = np.meshgrid(x_boundary, y_boundary)
colors_idx_boundary = np.random.randint(0, K, size=x_boundary.shape)

x_boundary_flat = x_boundary.flatten()
y_boundary_flat = y_boundary.flatten()

dists = np.zeros(K)
dists_idx = np.arange(1, K + 1)
Training the Model#
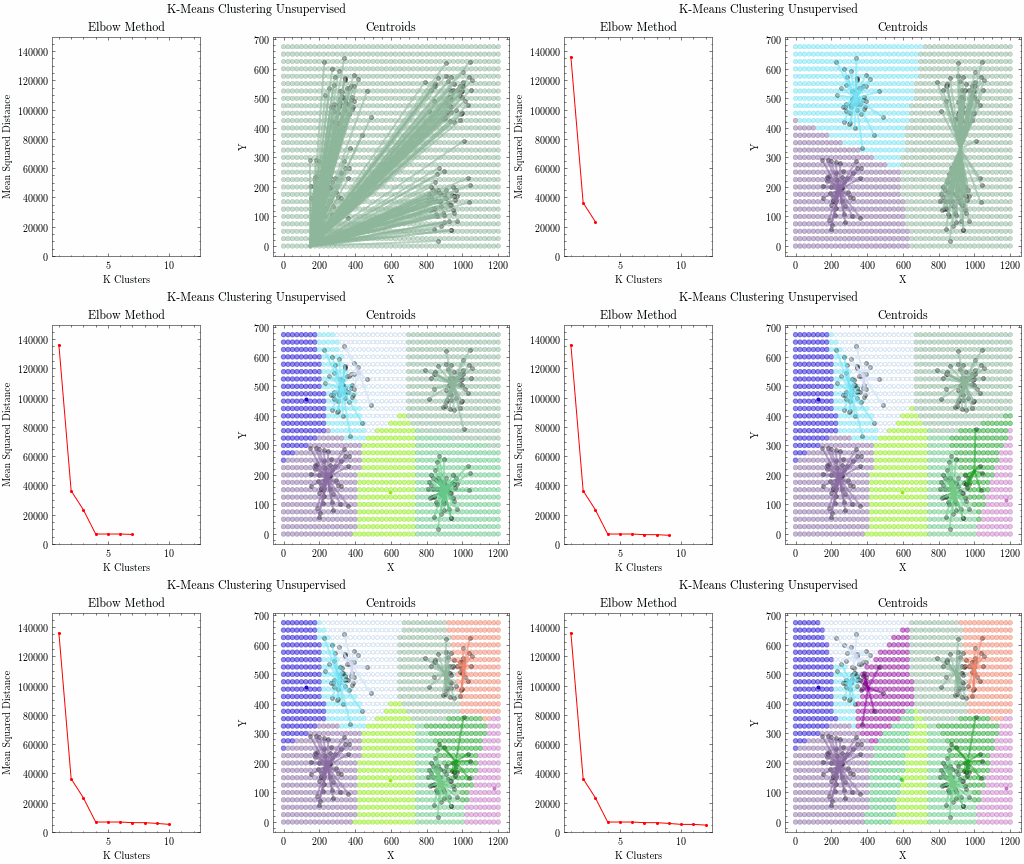
Let’s bring everything together. In this visualization, I show the centroids for varying values of K, which is the total number of centroids. For every value of K, I run the algorithm for a certain number of epochs. At the start, centroids start at a random location on the grid. In each epoch, points are assigned to the closest centroid. Then, the next location of the centroid is the average x and y value of all the points assigned to it in the previous iteration.
The left plot is the Elbow Method. For each value of K, it plots the mean squared distance between each point and its closest centroid. Adding centroids always lowers this distance, but after the true number of clusters the improvement becomes small. The bend in the curve, the “elbow”, suggests a good value of K. For this dataset, the elbow is at \(K = 4\).
ax0, ax1, camera = create_plots()
epochs = 8

output_filename = "k_means.gif"

for k in range(1, K + 1):
    acc_dist_squared = 0
    for e in range(epochs):
        # Draw the boundaries
        for index in np.ndindex(x_boundary.shape):
            x = x_boundary[index]
            y = y_boundary[index]

            colors_idx_boundary[index] = 0
            min_group = 0
            # set min distance to largest possible distance initially
            min_dist = np.sqrt(w**2 + h**2)

            curr_pt = [x, y]
            curr_c = []
            for c in range(k):
                curr_c = centroids[c]

                dist = euclidean_distance(curr_pt, curr_c)
                if dist < min_dist:
                    min_dist = dist
                    min_group = c
            colors_idx_boundary[index] = min_group

        colors_boundary = colors[colors_idx_boundary.flatten()]
        ax1.scatter(
            x_boundary_flat, y_boundary_flat, c=colors_boundary, s=20, alpha=0.45
        )

        # Assign each point to a centroid
        groups = [[] for _ in range(k)]
        acc_dist_squared = 0
        for i in range(nums):
            min_group = 0
            # set min distance to largest possible distance initially
            min_dist = np.sqrt(w**2 + h**2)

            curr_pt = pts[i]
            curr_c = []
            for c in range(k):
                curr_c = centroids[c]

                dist = euclidean_distance(curr_pt, curr_c)
                if dist < min_dist:
                    min_dist = dist
                    min_group = c

            groups[min_group].append(curr_pt)
            acc_dist_squared += min_dist**2

        # mean squared distance for the current value of K
        dists[k - 1] = acc_dist_squared / nums

        # Centroids
        for g in range(k):
            # Draw the centroids
            curr_centroid = centroids[g]
            curr_centroid = np.array([curr_centroid], dtype=np.int32)
            ax1.scatter(curr_centroid[:, 0], curr_centroid[:, 1], color=colors[g], s=8)

            group_pts = np.array(groups[g])
            if group_pts.size != 0:
                # Draw lines between points and the centroids
                pts_in_group = group_pts.shape[0]
                for i in range(pts_in_group):
                    group_pt = group_pts[i]
                    ax1.plot(
                        [group_pt[0], centroids[g][0]],
                        [group_pt[1], centroids[g][1]],
                        color=colors[g],
                        linewidth=2,
                        alpha=0.55,
                    )

                # Update the location of the centroids
                new_centroid = np.mean(group_pts, axis=0)
                centroids[g] = new_centroid
                new_centroid = np.array([new_centroid], dtype=np.int32)

        # Draw the points
        ax1.scatter(pts[:, 0], pts[:, 1], c="black", s=15, alpha=0.3)
        # Draw the Elbow Method graph, including the current value of K
        ax0.plot(dists_idx[:k], dists[:k], color="red", marker="o", markersize=2)
        camera.snap()
        # if e % 2 == 0:
        #     camera.snap()
        # else:
        #     ax0.clear()
        #     ax1.clear()

    print(f"K = {k}: mean squared distance = {dists[k - 1]:.1f}")

# fit the Elbow Method axis to the final distances, so the early epochs of each K
# (when centroids start at random positions) do not flatten the curve
ax0.set_ylim(0, 1.1 * dists.max())

animation = camera.animate()
animation.save("k_means.gif", writer="pillow")
plt.close()
K = 1: mean squared distance = 136163.1
K = 2: mean squared distance = 36390.7
K = 3: mean squared distance = 23327.9
K = 4: mean squared distance = 6812.9
K = 5: mean squared distance = 6812.9
K = 6: mean squared distance = 6812.9
K = 7: mean squared distance = 6373.3
K = 8: mean squared distance = 6373.3
K = 9: mean squared distance = 5852.3
K = 10: mean squared distance = 5181.5
K = 11: mean squared distance = 5181.5
K = 12: mean squared distance = 4721.5
Image(filename=output_filename)